
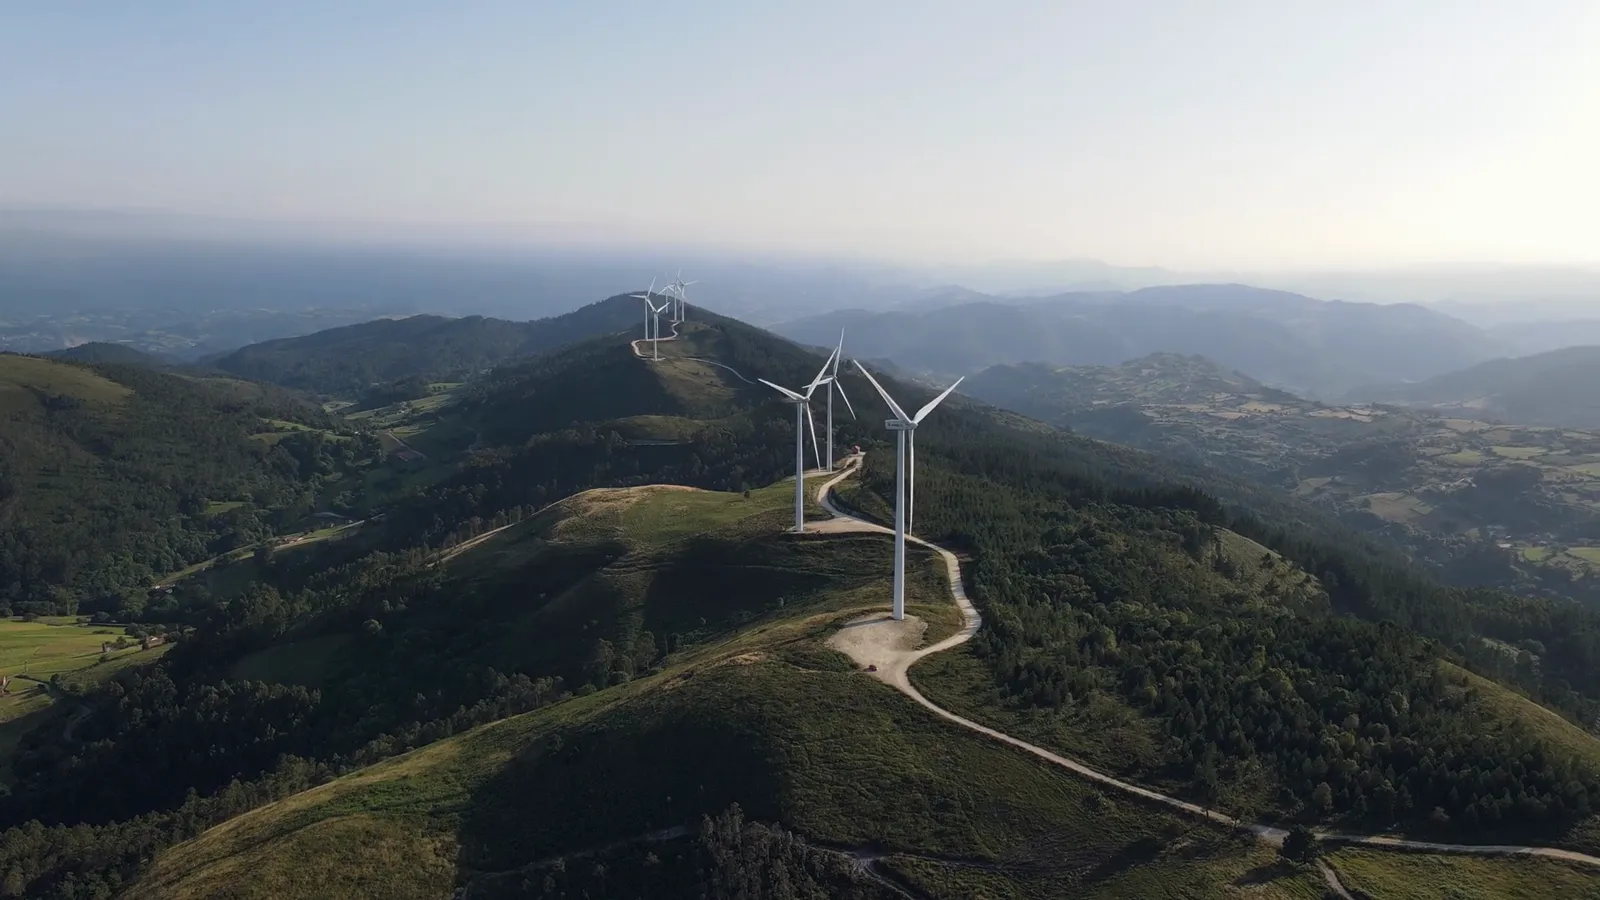
Real wind turbines in operation

INDUSTRYNORTH / Wind

Read the signals before performance slips.

Separate changing weather from developing equipment problems. Help your team prioritize the turbines and components that need investigation.

REAL OPERATIONS · LICENSED ILLUSTRATIVE FOOTAGECredits ↗

01 / THE CORE PACKAGE

A clear foundation. Value you can assess.

Start with the assets and data that matter. We agree on scope and success criteria before building.

INCLUDED WITHIN THE AGREED SCOPE

Wind
Core analytics

  • 01Condition-adjusted power models
  • 02Gearbox, generator and bearing behavior
  • 03Sensor consistency and peer comparisons
  • 04Evidence-backed investigation priorities

Data assessment, model validation, and delivery into your tools: Power BI, Tableau, custom applications or CMMS.

Extend where it makes sense.

Optional modules selected for value and data readiness.

+

Yaw and pitch performance analysis

+

Icing and derating classification

+

CMS vibration diagnostics

+

Maintenance campaign planning

Data and technical scope

SCADA power, wind, ambient and component temperatures, operating states, alarms and maintenance history. Vibration diagnostics require CMS measurements.

A temperature deviation is an investigation signal. Confirm causes with maintenance evidence; validate failure predictions against labeled historical events.

02 / WHAT A FINDING LOOKS LIKE

Investigate a warmer gearbox

The gearbox ends 9.2°C above its illustrative expected temperature at comparable operating conditions.

ILLUSTRATIVE EXAMPLE · NOT A CLIENT RESULT
WT-07 departs from its temperature baselineILLUSTRATIVE DATA
WT-07 departs from its temperature baseline019.138.257.376.4°CD1D6D12Time
ExpectedObserved
D12 · Expected: 59 °C · Observed: 68.2 °C

Synthetic measurements and an illustrative expected profile. Select a point to inspect its values.

View the data
TimeExpected (°C)Observed (°C)
D15757.3
D258.358.6
D35959.3
D458.759
D557.758.9
D656.358.6
D755.358.8
D85559.6
D955.761.5
D105763.9
D1158.366.4
D125968.2
The energy signal provides additional contextILLUSTRATIVE DATA
The energy signal provides additional context07001,4002,1002,800kW4812Wind speed · m/s
ExpectedObserved
12 · Expected: 2,500 kW · Observed: 2,250 kW

Illustrative power points after air-density and operating-state normalization; not an OEM guarantee curve.

View the data
Wind speed · m/sExpected (kW)Observed (kW)
4100102
5200204
6380370
7620610
8980925
91,3901,290
101,8401,660
112,3002,050
122,5002,250

03 / FROM EVIDENCE TO DECISION

Watch the AI workflow unfold.

Explore each stage. See the sources, the proposal, and the point where your team decides.

OPERATIONS INTELLIGENCESIMULATION
YOUR DATA. YOUR TEAM IN CONTROL.
WT-07

Investigate a warmer gearbox

+9.2°Csample thermal deviation
01

A signal worth investigating.

The gearbox ends 9.2°C above its illustrative expected temperature at comparable operating conditions.

WT-07 departs from its temperature baselineILLUSTRATIVE DATA
WT-07 departs from its temperature baseline019.138.257.376.4°CD1D6D12Time
ExpectedObserved
D12 · Expected: 59 °C · Observed: 68.2 °C

Synthetic measurements and an illustrative expected profile. Select a point to inspect its values.

0:00 / 0:40

Illustrative data · sample documents · simulated workflow. These are not client results.

Read the complete story

Investigate a warmer gearbox

The gearbox ends 9.2°C above its illustrative expected temperature at comparable operating conditions.

The temperature diverges at comparable load. Review cooling and lubrication history [1][2], then inspect supporting signals. This is an investigation hypothesis, not a confirmed diagnosis.

  1. Review trends and operating conditions
  2. Consult the applicable technical procedure
  3. Document findings before intervention

A maintenance investigation is ready to plan.

Explore all 10 AI workflows ↗

04 / MANAGED ANALYTICS

A useful model needs care.

Equipment changes. Sensors drift. Operations evolve. We keep models aligned with that reality.

See model care in action ↗
  1. 01Monitor data quality and model drift
  2. 02Investigate changes before retraining
  3. 03Validate on held-out periods and known events
  4. 04Review versions, deployment and rollback
  5. 05Incorporate engineering feedback