
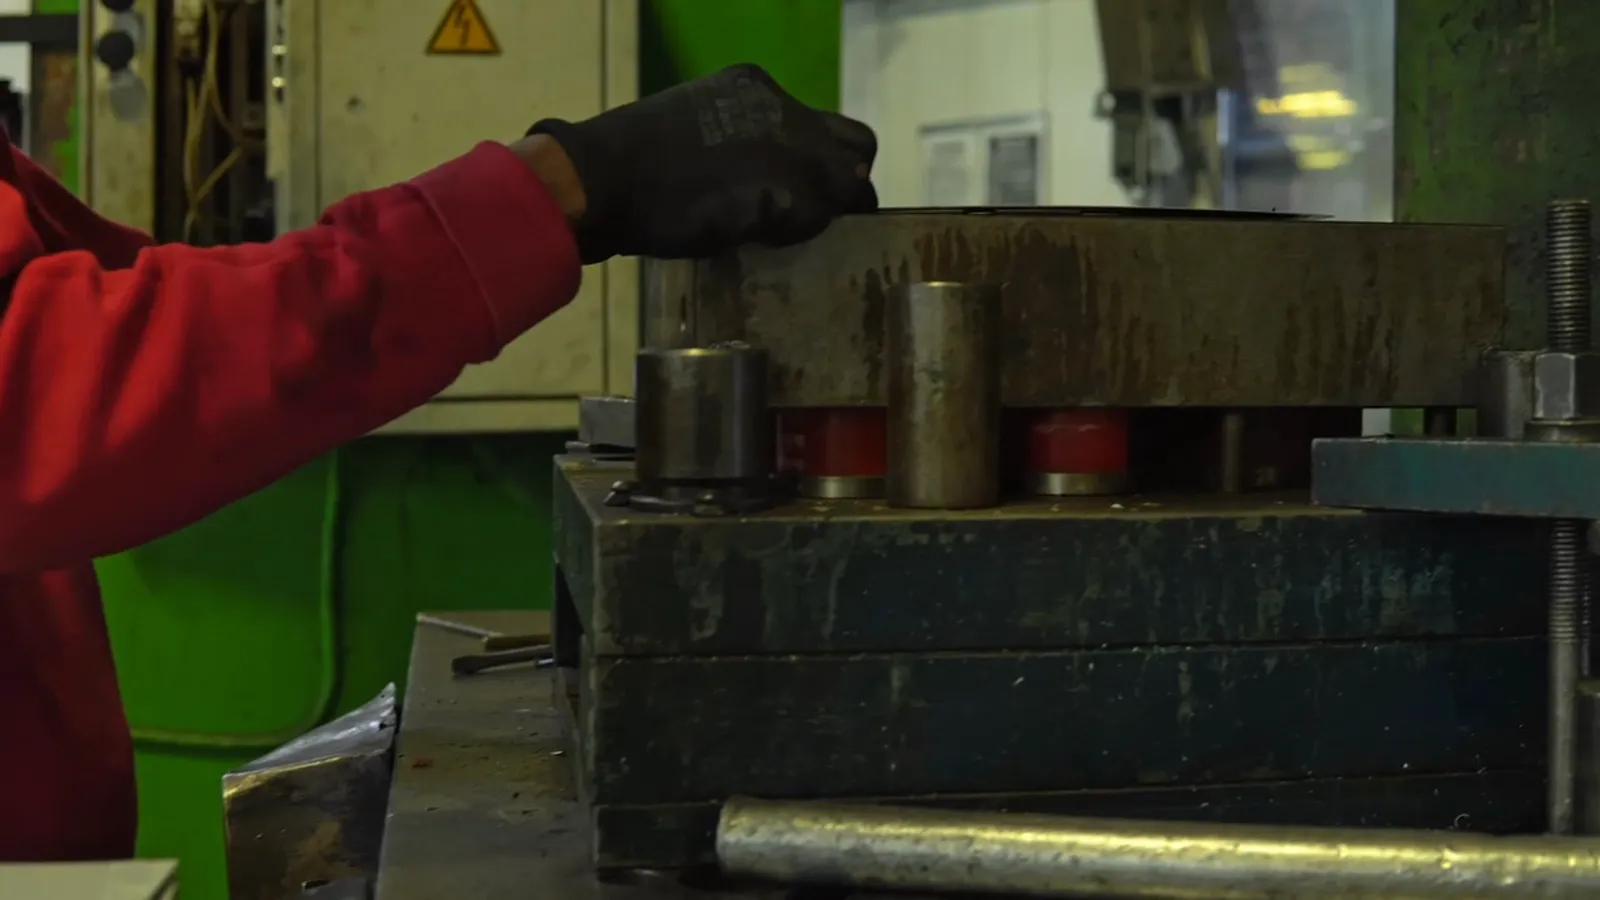
Real operating industrial machinery

INDUSTRYNORTH / Manufacturing

Find the change that is costing your plant.

Connect operating conditions, equipment health and production context. Focus engineering effort on the deviations that affect throughput, quality and energy use.

REAL OPERATIONS · LICENSED ILLUSTRATIVE FOOTAGECredits ↗

01 / THE CORE PACKAGE

A clear foundation. Value you can assess.

Start with the assets and data that matter. We agree on scope and success criteria before building.

INCLUDED WITHIN THE AGREED SCOPE

Manufacturing
Core analytics

  • 01Equipment models by operating mode
  • 02Energy consumption per unit produced
  • 03Persistent anomaly investigation
  • 04Maintenance context and prioritized findings

Data assessment, model validation, and delivery into your tools: Power BI, Tableau, custom applications or CMMS.

Extend where it makes sense.

Optional modules selected for value and data readiness.

+

Quality prediction with soft sensors

+

Defect-driver analysis

+

Process-setting recommendations

+

Technical-document and maintenance workflows

Data and technical scope

PLC/historian signals, operating modes, production counts, product/batch context and maintenance records. Quality models need aligned laboratory or inspection labels.

Compare like operating conditions and product mixes. Statistical associations prioritize investigation; they do not establish a confirmed physical cause.

02 / WHAT A FINDING LOOKS LIKE

Explain a rise in energy per tonne

Energy intensity rises approximately 18% in the example’s loaded production modes.

ILLUSTRATIVE EXAMPLE · NOT A CLIENT RESULT
More energy for the same production contextILLUSTRATIVE DATA
More energy for the same production context06.112.218.224.3kWh/tD1D6D12Time
ExpectedObserved
D12 · Expected: 17.6 kWh/t · Observed: 20.8 kWh/t

Synthetic measurements and an illustrative expected profile. Select a point to inspect its values.

View the data
TimeExpected (kWh/t)Observed (kWh/t)
D11818
D218.318.3
D318.418.4
D418.118.1
D517.717.7
D617.620.8
D717.921.1
D818.321.6
D918.421.7
D1018.221.5
D1117.821
D1217.620.8
The loaded mode explains most of the differenceILLUSTRATIVE DATA
The loaded mode explains most of the difference06.913.920.827.8kWh/tABCDProduct / operating group
ExpectedObserved
D · Expected: 20 kWh/t · Observed: 20.2 kWh/t

Four matched product/mode groups. This ranks associations for investigation, not proven physical causes.

View the data
Product / operating groupExpected (kWh/t)Observed (kWh/t)
A1821.2
B2124.8
C1616.1
D2020.2

03 / FROM EVIDENCE TO DECISION

Watch the AI workflow unfold.

Explore each stage. See the sources, the proposal, and the point where your team decides.

OPERATIONS INTELLIGENCESIMULATION
YOUR DATA. YOUR TEAM IN CONTROL.
LINE-04

Explain a rise in energy per tonne

+18%approximate sample energy intensity
01

A signal worth investigating.

Energy intensity rises approximately 18% in the example’s loaded production modes.

More energy for the same production contextILLUSTRATIVE DATA
More energy for the same production context06.112.218.224.3kWh/tD1D6D12Time
ExpectedObserved
D12 · Expected: 17.6 kWh/t · Observed: 20.8 kWh/t

Synthetic measurements and an illustrative expected profile. Select a point to inspect its values.

0:00 / 0:40

Illustrative data · sample documents · simulated workflow. These are not client results.

Read the complete story

Explain a rise in energy per tonne

Energy intensity rises approximately 18% in the example’s loaded production modes.

The difference remains after matching production context [1]. Review drive and auxiliary-system evidence [2] before assigning a cause. The model prioritizes the investigation.

  1. Confirm production-count and meter alignment
  2. Inspect comparable loaded-mode periods
  3. Prepare a maintenance and verification brief

A focused energy investigation is ready for the plant team.

Explore all 10 AI workflows ↗

04 / MANAGED ANALYTICS

A useful model needs care.

Equipment changes. Sensors drift. Operations evolve. We keep models aligned with that reality.

See model care in action ↗
  1. 01Monitor data quality and model drift
  2. 02Investigate changes before retraining
  3. 03Validate on held-out periods and known events
  4. 04Review versions, deployment and rollback
  5. 05Incorporate engineering feedback