SCADA signals
Load, temperature, and ambient
Evidence connected


AI & ANALYTICS FOR ENERGY AND INDUSTRY
From the signals inside a machine to the performance of an entire portfolio. We turn operational data into decisions that move your business forward.
BUILT AROUND YOUR OPERATION
SCADA, historians, sensors, and maintenance records tell different parts of the same story. We bring them together to show where performance is being lost, why, and what to do next.
FROM SIGNAL TO ACTION
Watch an investigation unfold. An alert becomes evidence, technical documents become answers, and an informed decision becomes a maintenance action—with your team in control.
 OPERATIONS INTELLIGENCESAMPLE DATA
Gearbox temperature above the expected operating range.
Investigate with evidence → Investigation agent
Load, temperature, and ambient
Turbines under similar conditions
Alarms and previous work orders
A persistent deviation warrants reviewing the cooling circuit and lubrication history.
[1] PDF · § 4.2A cooling-system inspection was recorded during the previous intervention.
[2] CMMS · WO-018Temperature is diverging from its expected range under comparable load. Review the cooling and lubrication history first. [1] [2]
Investigation hypothesis for engineer review; not a confirmed diagnosis.Reliability engineer · simulation
From a signal to an informed decision.
BUILT AROUND YOUR OPERATION.
Explore the systems we work with—and the intelligence we build around them.
MODELS · EVIDENCE · ACTION
Know which assets deserve attention, what the lost energy is worth, and which action to investigate first.
Explore package & examples ↗
MODELS · EVIDENCE · ACTION
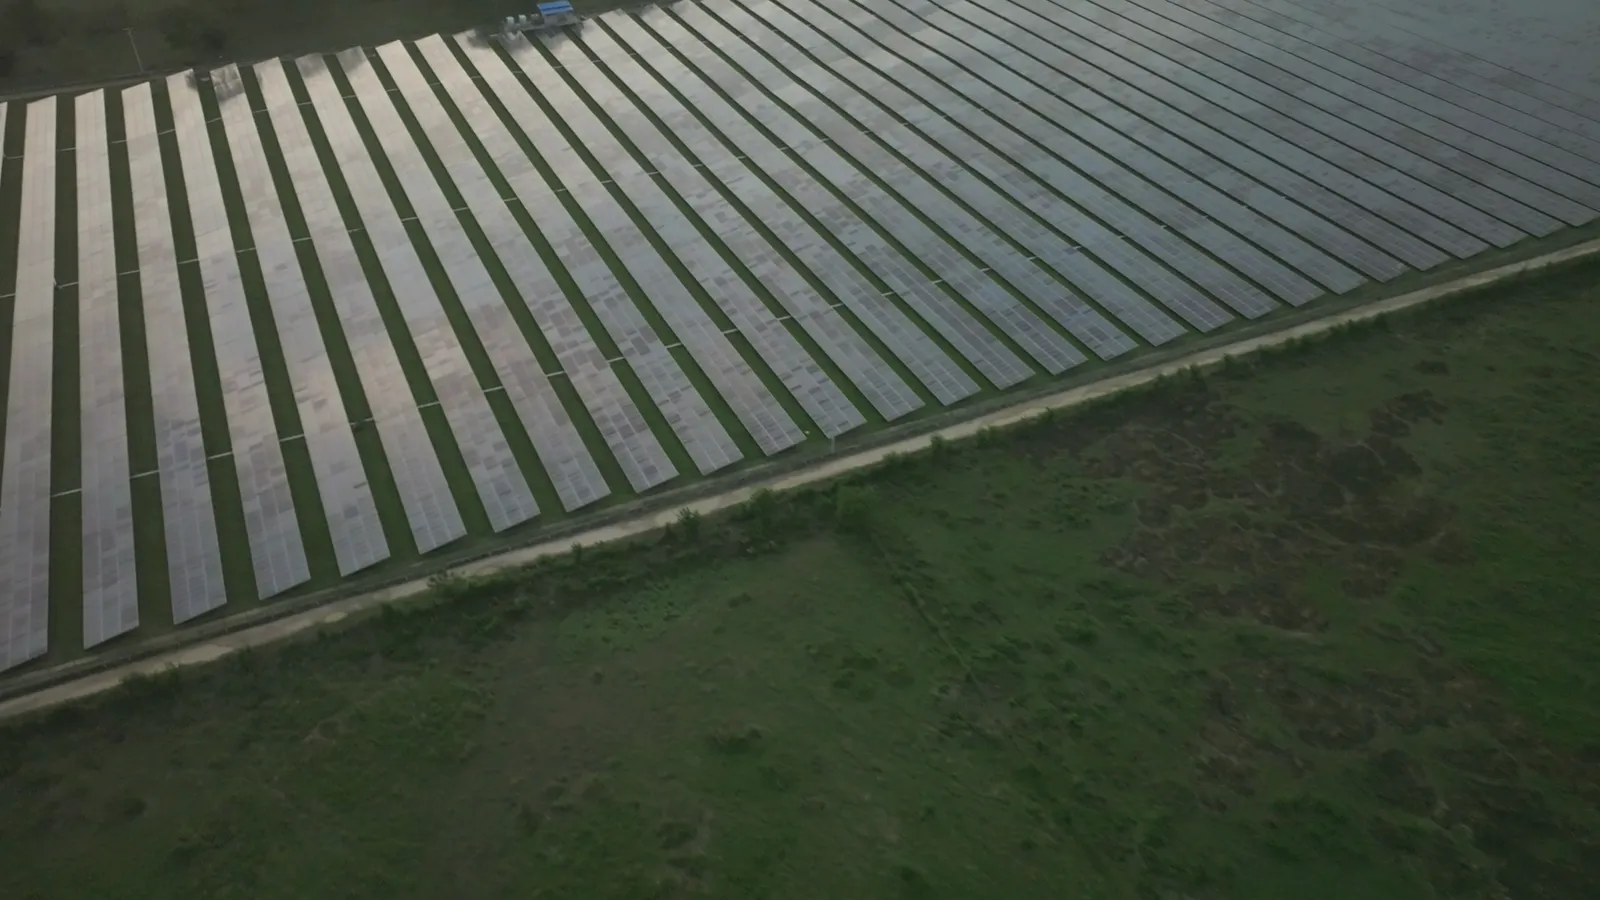
Connect panel performance to production schedules and electricity costs. See where your solar investment can deliver more useful energy.
Explore package & examples ↗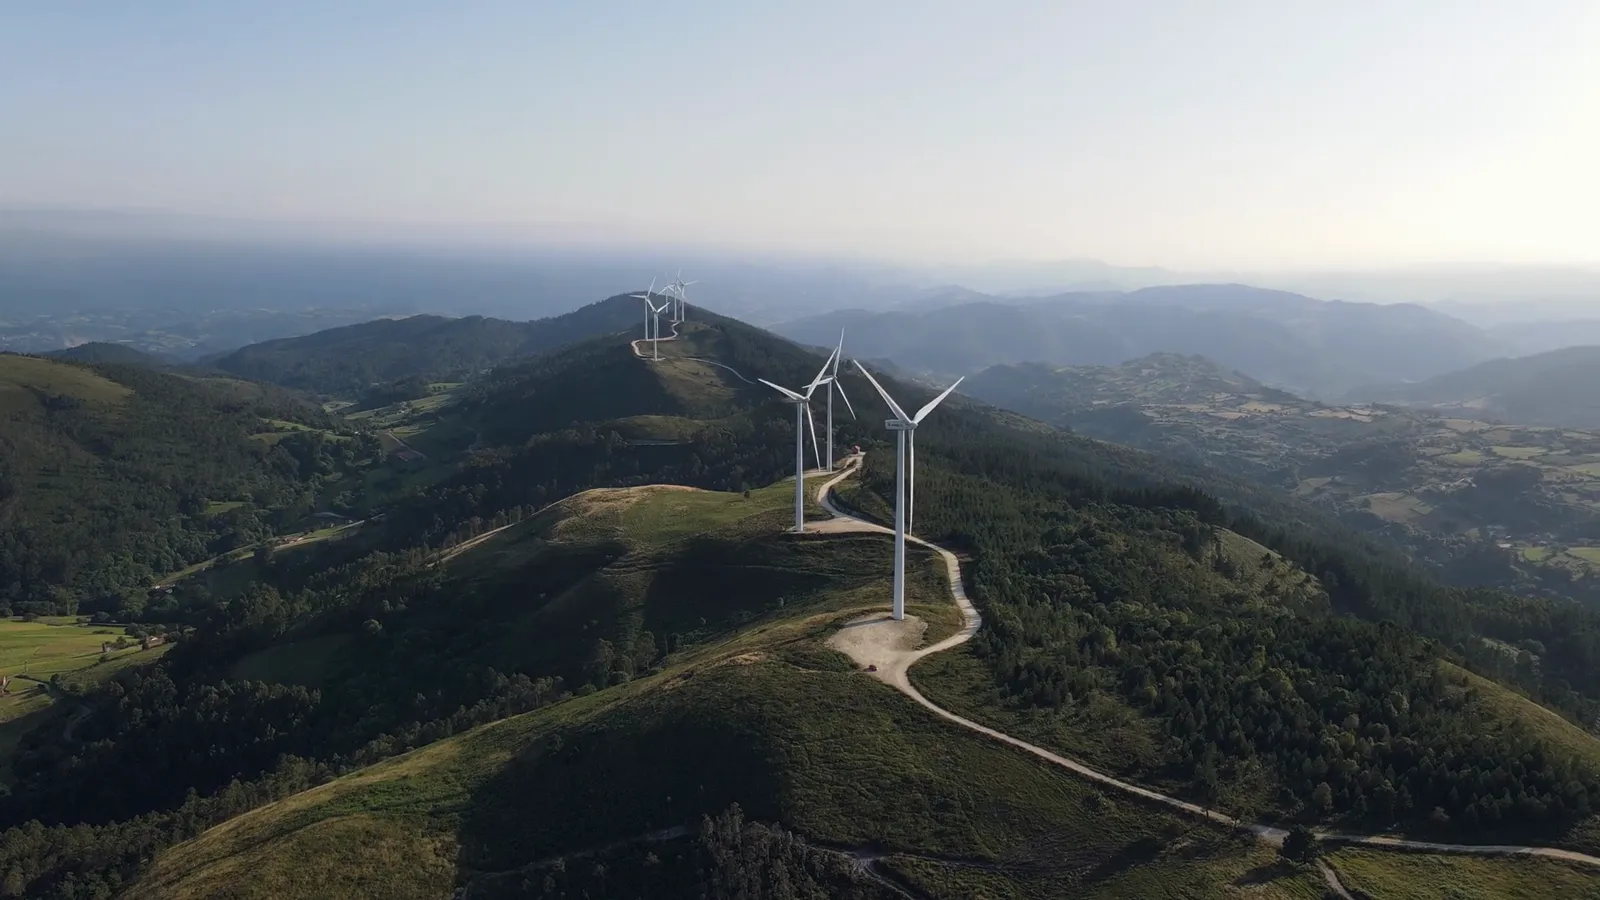
MODELS · EVIDENCE · ACTION
Separate changing weather from developing equipment problems. Help your team prioritize the turbines and components that need investigation.
Explore package & examples ↗
MODELS · EVIDENCE · ACTION
Understand which racks behave differently, where efficiency is slipping, and how operating choices affect long-term battery value.
Explore package & examples ↗
MODELS · EVIDENCE · ACTION
Give production and reliability teams a shared view of the wells worth investigating, the evidence behind each finding, and the operating options to review.
Explore package & examples ↗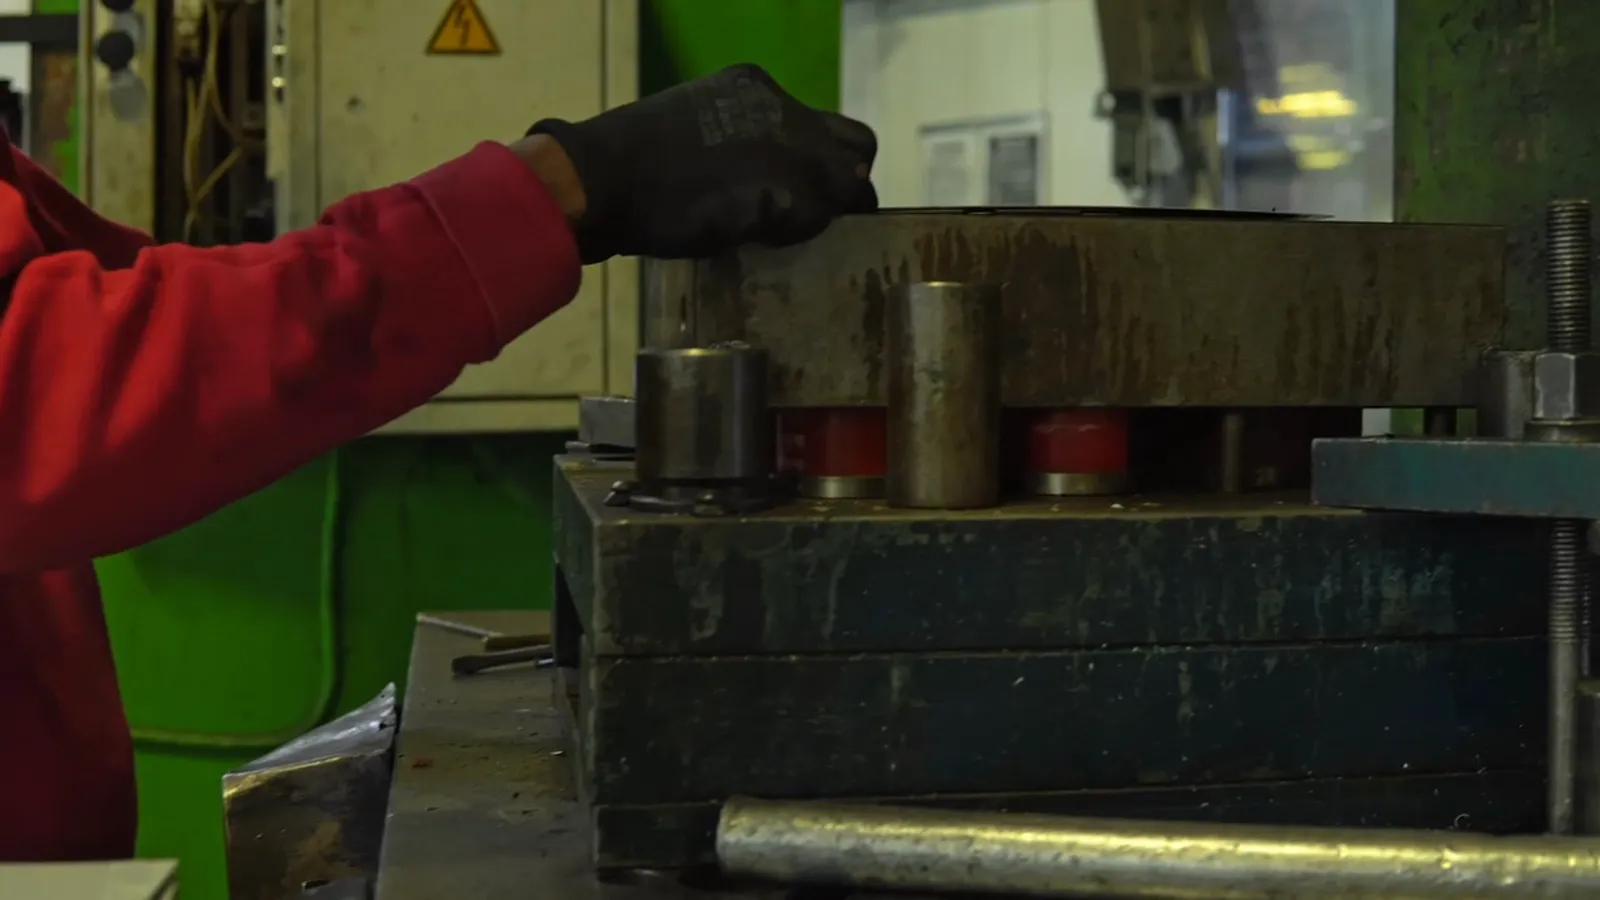
MODELS · EVIDENCE · ACTION
Connect operating conditions, equipment health and production context. Focus engineering effort on the deviations that affect throughput, quality and energy use.
Explore package & examples ↗START WHERE IT MATTERS
Seven ways to work together. One open platform that grows with your operation.
Understand your data, identify the opportunities, and prioritize a first use case by economic impact.
2–3 WEEKSTest one use case on your historical data, with success criteria agreed before work begins.
4–8 WEEKSConnect ingestion, a shared data model, KPIs, loss analysis, alerts, and dashboards.
6 WEEKS–5 MONTHSBuild anomaly detection, normal-behavior models, forecasts, and maintenance intelligence.
IMPLEMENTATION / EXTENSIONConnect assistants, investigation agents, technical knowledge, and operational workflows.
4–12 WEEKS PER USE CASEKeep the system working: monitoring, retraining, data quality, and continuous improvement.
ONGOINGBuild with your engineers, transfer the methods, and leave a system your team can extend.
PER ENGAGEMENTA PARTNER FROM THE FIRST SIGNAL
Start with your operation, your data, and a question worth answering.
Agree on the outcome. Demonstrate it on your data before expanding.
Deliver into Power BI, Tableau, custom applications, or your CMMS.
Monitor, retrain, and improve—or equip your team to take it forward.
Energy and industrial methods, grounded in our team’s delivery experience.
An open-source stack, deployed in your cloud or ours. Your data and results remain yours.
Adaptable analytics that respect your thresholds, reference methods, and operating rules.